Continuous improvement tools that work
Continuous improvement tools including the 5 Whys from Taiichi Ohno at Toyota and the 7 Quality Tools from Kaoru Ishikawa help teams find root causes and fix broken workflows. This guide covers which proven methods deliver real results and how to pick the right one for your situation.
Summary
- The 5 Whys strip away symptoms to expose root causes - Toyota’s deceptively simple technique asks “why” five times to dig past surface-level complaints and find what’s really broken; no data science degree required, just stubborn curiosity that stops the same fires from reigniting
- DRIVE turns fuzzy problems into concrete action - Define success criteria, Review the current mess, Identify fixes, Verify they’ll hit the mark, Execute and collect feedback; this structure kills analysis paralysis by forcing teams to get specific early
- Process mapping makes invisible bottlenecks obvious - ICOR (Inputs, Outputs, Controls, Resources) breaks tangled workflows into pieces everyone can see; teams stop guessing and start making decisions based on what’s actually happening. See how Tallyfy powers continuous improvement
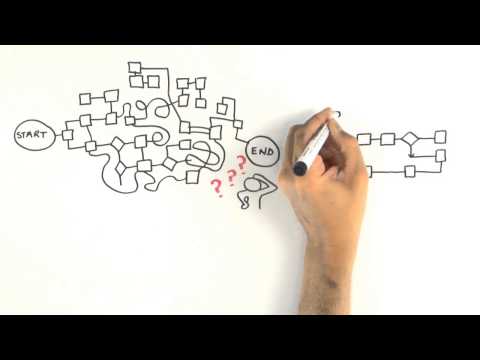
Continuous improvement tools exist because every process decays over time. That’s the blunt truth. What worked last year is probably dragging you down today. These tools give you structured ways to find what’s broken, figure out why, and fix it before the problem compounds.
Here’s what most people miss: you don’t need all of them. You need the right one for your situation.
I cannot say whether things will get better if we change; what I can say is they must change if they are to get better.
No matter what your team does - whether it’s onboarding, procurement, compliance checks - there’s always room to tighten things up. The trick isn’t finding problems. It’s picking the right tool to solve them without creating new ones.

5 Whys and finding root causes

Taiichi Ohno, former Executive Vice President at Toyota, had a brilliant saying that stuck with me: “Having no problems is the biggest problem of all.”
He wasn’t being cute. He meant that if you can’t see problems, you’re not looking hard enough. And most teams aren’t looking - they’re reacting. Something breaks, they patch it, and the same thing breaks again three weeks later.
The 5 Whys came out of the Toyota Production System and became a cornerstone of Lean Manufacturing, Kaizen, and Six Sigma. The concept is sort of embarrassingly simple. You ask “why” five times. Each answer peels back a layer until you’re staring at the actual root cause.
Why did the shipment arrive late? Because it wasn’t packed on time. Why wasn’t it packed on time? Because the parts weren’t ready. Why weren’t the parts ready? Because the supplier order was delayed. Why was the supplier order delayed? Because nobody submitted the purchase request. Why didn’t anyone submit the purchase request? Because there’s no trigger in the workflow to remind them.
That’s it. No fancy analytics. No dashboards. Just persistent questioning.
The beauty of the 5 Whys is that anyone can use them. You don’t need training or software or a statistics background. You need a team that’s willing to be straight about what’s going wrong - and that’s the hard part. What surprised us when we dug into the data from teams using Tallyfy for process improvement was how often the root cause turned out to be absurdly simple - a missing notification, a confusing form field, an approval step that nobody remembered existed. The fix was often trivially simple once they found it. The waste was in all those months of applying band-aids instead of asking “why” one more time.
Once you’ve pinpointed root causes, you need a system to track fixes and make sure they stick. That’s where process improvement software comes in - it bridges the gap between “we know what’s wrong” and “we’ve actually fixed it.”
Tallyfy is Process Improvement Made Easy
DRIVE method and process mapping

DRIVE is a continuous improvement method that forces you to break vague problems into steps you can actually execute. The acronym stands for Define, Review, Identify, Verify, and Execute.
Start by defining the problem and deciding how you’ll know if you’ve solved it. This sounds obvious, but you’d be surprised how many improvement efforts launch without clear success criteria. “Make things better” isn’t a goal. “Reduce approval turnaround from 5 days to 2” is.
Then review the current state. What’s happening right now? Where are the delays, the handoffs, the confusion? Don’t assume you know - go look.
Identify potential solutions. Not one solution. Multiple. Because your first idea probably isn’t your best one.
Verify that your chosen fix will actually meet the criteria you defined at the start. This step catches a lot of wasted effort before it happens.
Execute. Roll it out, gather feedback, and review whether it worked. If it didn’t - and sometimes it won’t - you’ve got data to try again.
Process mapping pairs well with DRIVE. It’s a visual representation of how work flows through a process. When you map things out, bottlenecks that were invisible in spreadsheets and email threads suddenly become glaringly obvious.
The ICOR method - Inputs, Outputs, Controls, Resources - gives you a structured way to break processes into digestible parts. You brainstorm activities, group them into 4-6 sub-processes, identify connections between them, and define each using ICOR.
What I like about process mapping is that it gives every team member the same picture. No more “I thought you were handling that” conversations. Everyone can point to the map and say “here’s where it breaks.”
Turns out, this is also where AI enters the picture. If your process map reveals a deeply broken workflow, automating it with AI just means it breaks faster and at higher volume. To be fair, that’s an oversimplification. Fix the process first. Automate second.
The 7 Quality Tools explained

Kaoru Ishikawa, a professor of engineering at the University of Tokyo, championed seven quality tools that remain surprisingly useful decades later. They’re generic enough to apply almost anywhere and specific enough to generate real insights. Not bad for tools from the 1960s.
Here’s the rundown:
Flow charts map a sequence of events to find patterns and commonalities. They turn messy processes into something visual and understandable. If you can’t draw your process on a whiteboard, you probably don’t understand it well enough.
Histograms show distribution patterns. A normal distribution gives you a bell curve; anything else tells you something interesting is happening. They’re useful for spotting outliers and understanding variation.
Cause-and-effect diagrams (also called fishbone diagrams) trace problems back to their sources. They work well as a group exercise - get the team in a room, brainstorm causes, and you’ll often find the root issue faster than any individual analysis would.
Check sheets are the simplest tool here. A spreadsheet where you collect and organize data. Nothing fancy. But structured data collection beats guessing every time.
Scatter diagrams plot two variables against each other to reveal relationships. Is there a connection between order size and delivery delays? Plot it. The pattern either shows up or it doesn’t.
Control charts monitor process stability over time. They’re especially good for spotting when a process starts drifting before it becomes a full-blown nightmare.
Pareto charts apply Vilfredo Pareto’s 80/20 rule visually. Bars show individual causes in descending order while a line tracks the cumulative total. They help you focus on the few causes driving most of your problems - which is where your energy should go.
Put continuous improvement into practice
Why teams get stuck - and how to break through

The biggest trap I’ve seen? Waiting for the perfect solution before doing anything at all.
Teams get stuck in analysis paralysis while their competitors make dozens of small adjustments and pull ahead. A good-enough improvement shipped today beats a flawless solution that never launches. I’ve watched organizations spend months designing the ideal process on paper while everyone else iterated their way to better results.
The teams that win treat improvement like a muscle. You build it through regular exercise, not by waiting until you can bench press the heaviest weight on day one. After watching hundreds of teams try this at Tallyfy, the ones who ship one small fix per week consistently outperform the ones who plan a massive overhaul every quarter.
This also means creating an environment where people feel safe to experiment. When teams know that a failed improvement attempt won’t result in blame, they actually try things. In conversations we’ve had with operations leaders, shifting the question from “who messed up?” to “what did we learn?” consistently doubles the number of improvement ideas teams submit. Psychological safety isn’t some soft concept - it directly affects whether your continuous improvement tools get used or collect dust.
At Tallyfy, we’ve built this thinking into the product itself. When you can track a process, see where it stalls, and adjust it without a six-month IT project, improvement becomes a habit instead of a quarterly initiative.
Picking the right tool for your situation
Not every tool fits every problem. Here’s my take on when to reach for what:
Got a recurring problem you can’t shake? Start with the 5 Whys. It’s fast, it’s free, and it usually surfaces something you hadn’t considered.
Facing a vague, multi-layered issue? DRIVE gives you structure when the path forward isn’t clear.
Need to understand how work actually flows (versus how you think it flows)? Process mapping with ICOR. Every time.
Want data-driven clarity on what’s causing quality issues? The 7 Quality Tools - especially Pareto charts and root cause analysis techniques - help you focus where it matters.
Is there a single best tool? No. The mistake is picking a tool because it sounds impressive. Pick one because it matches the problem you’re staring at right now.
And if you’re thinking about layering AI or automation on top of your processes - and you should be - make sure the underlying workflow is solid first. Process quality is performance. Get the process right, then let technology amplify the results. That’s the sequence that works.
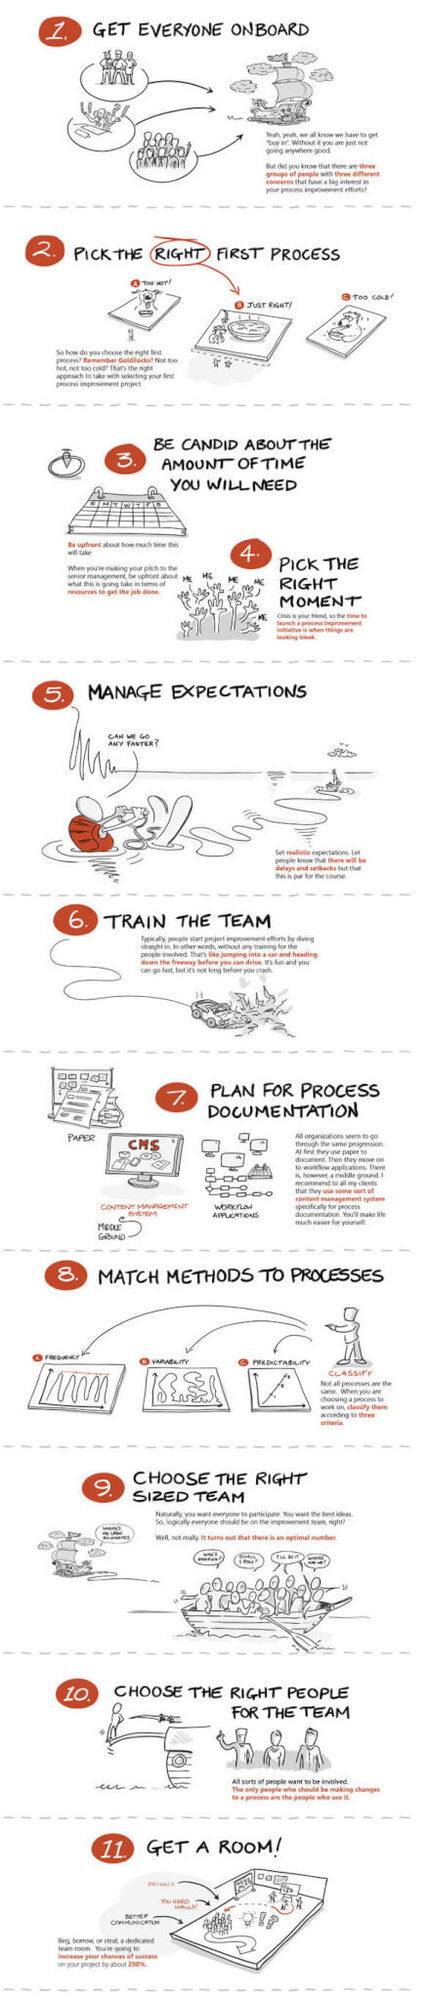
Bonus infographic - “How do you prepare for process improvement?”
Courtesy of the Process Consultant.
Related questions
What are continuous improvement tools?
They’re methods and techniques for making work better over time. Think of them as a toolbox - varied approaches to problem-solving, waste reduction, and smoother processes. Examples include process mapping, W. Edwards Deming’s PDCA cycles, 5S workplace organization, and root cause analysis. Each one helps teams spot problems, collect data, and make smart changes.
What are the 8 Lean tools?
Eight practical methods for reducing waste and improving flow. They include Value Stream Mapping (charting how work moves through a process), 5S (organizing workspaces), Kanban (visual management boards), Standardized Work (clearly defined steps), Visual Controls (signs and signals), Quick Changeover (faster transitions), Quality at the Source (catching problems early), and Total Productive Maintenance (keeping equipment healthy).
What are Kaizen tools?
Kaizen is about small, daily improvements. Key tools include the 5 Whys (asking why until you hit the root cause), A3 Problem Solving (fitting the whole problem on one page), Gemba Walks (going where work happens), and Quality Circles (team-based problem solving). These tools support a culture where everyone’s trying to make their work a little better each day.
Is Six Sigma a continuous improvement tool?
Six Sigma isn’t just a tool - it’s an entire improvement system that uses many tools. It’s driven by data and statistics. While it includes methods like DMAIC (Define, Measure, Analyze, Improve, Control), it’s more accurate to see Six Sigma as a system that pulls in other continuous improvement tools to chase near-perfect quality output.
What are the 4 Ps of continuous improvement?
Purpose (why you’re making changes), People (getting everyone involved), Process (having a clear method for change), and Performance (tracking results). These four work together to create lasting change rather than short-lived fixes.
What is a KPI in continuous improvement?
KPIs (Key Performance Indicators) are the metrics that tell you whether improvements are working. Think of them as scorecards tracking quality, speed, cost, or satisfaction. Good KPIs are clear, specific, and guide teams toward understanding whether their changes made things better or worse.
What are the benefits of using continuous improvement tools?
They cut mistakes, save money, and keep people engaged. They’re useful for catching problems before they spiral, making work smoother and safer, and building a workplace where people feel heard. Perhaps most importantly, they keep organizations competitive by relentlessly improving how they operate.
How to start continuous improvement?
Begin small. Pick one problem that frustrates people every day. Use a simple tool like process mapping to understand what’s happening now, then collect ideas from the people who actually do the work. Make a small change, measure whether it helped, build confidence, then tackle something bigger. Small changes that stick beat big changes that don’t.
What is the main goal of continuous improvement?
Making things better - even in small ways - every day. It’s about creating a workplace where everyone looks for ways to remove friction and deliver more value. Unlike big overhaul programs that aim for revolutionary change, continuous improvement builds through gradual wins that compound over time.
How do you measure continuous improvement success?
Track both numbers and signals. Watch metrics like error rates, delivery times, and cost savings - but also look for softer signs like more team suggestions, better collaboration, and fewer daily frustrations. The best measurement systems combine hard data with real feedback from the people doing the work.
What role does leadership play in continuous improvement?
Leadership sets the conditions for improvement to happen. In discussions we’ve had with operations leaders across industries, they consistently emphasize that leaders must provide time, resources, and air cover for improvement work. The most effective leaders are hands-on in the process and actively remove obstacles that block positive change.
How often should continuous improvement activities happen?
Improvement isn’t a quarterly event - it’s a daily practice. You might have weekly team check-ins or monthly reviews, but the mindset of getting better should run through every shift, every meeting, and every decision. The goal is turning improvement into a habit, not a special project.
About the Author
Amit is the CEO of Tallyfy. He is a workflow expert and specializes in process automation and the next generation of business process management in the post-flowchart age. He has decades of consulting experience in task and workflow automation, continuous improvement (all the flavors) and AI-driven workflows for small and large companies. Amit did a Computer Science degree at the University of Bath and moved from the UK to St. Louis, MO in 2014. He loves watching American robins and their nesting behaviors!
Follow Amit on his website, LinkedIn, Facebook, Reddit, X (Twitter) or YouTube.

Automate your workflows with Tallyfy
Stop chasing status updates. Track and automate your processes in one place.